User Research Study
New ePlanner layers and updated data display
UX Researcher
Data analysis, User interviews, Hi-fidelity mockup
Urban Redevelopment Authority (URA)
Splunk
UX researchers, Planning executive
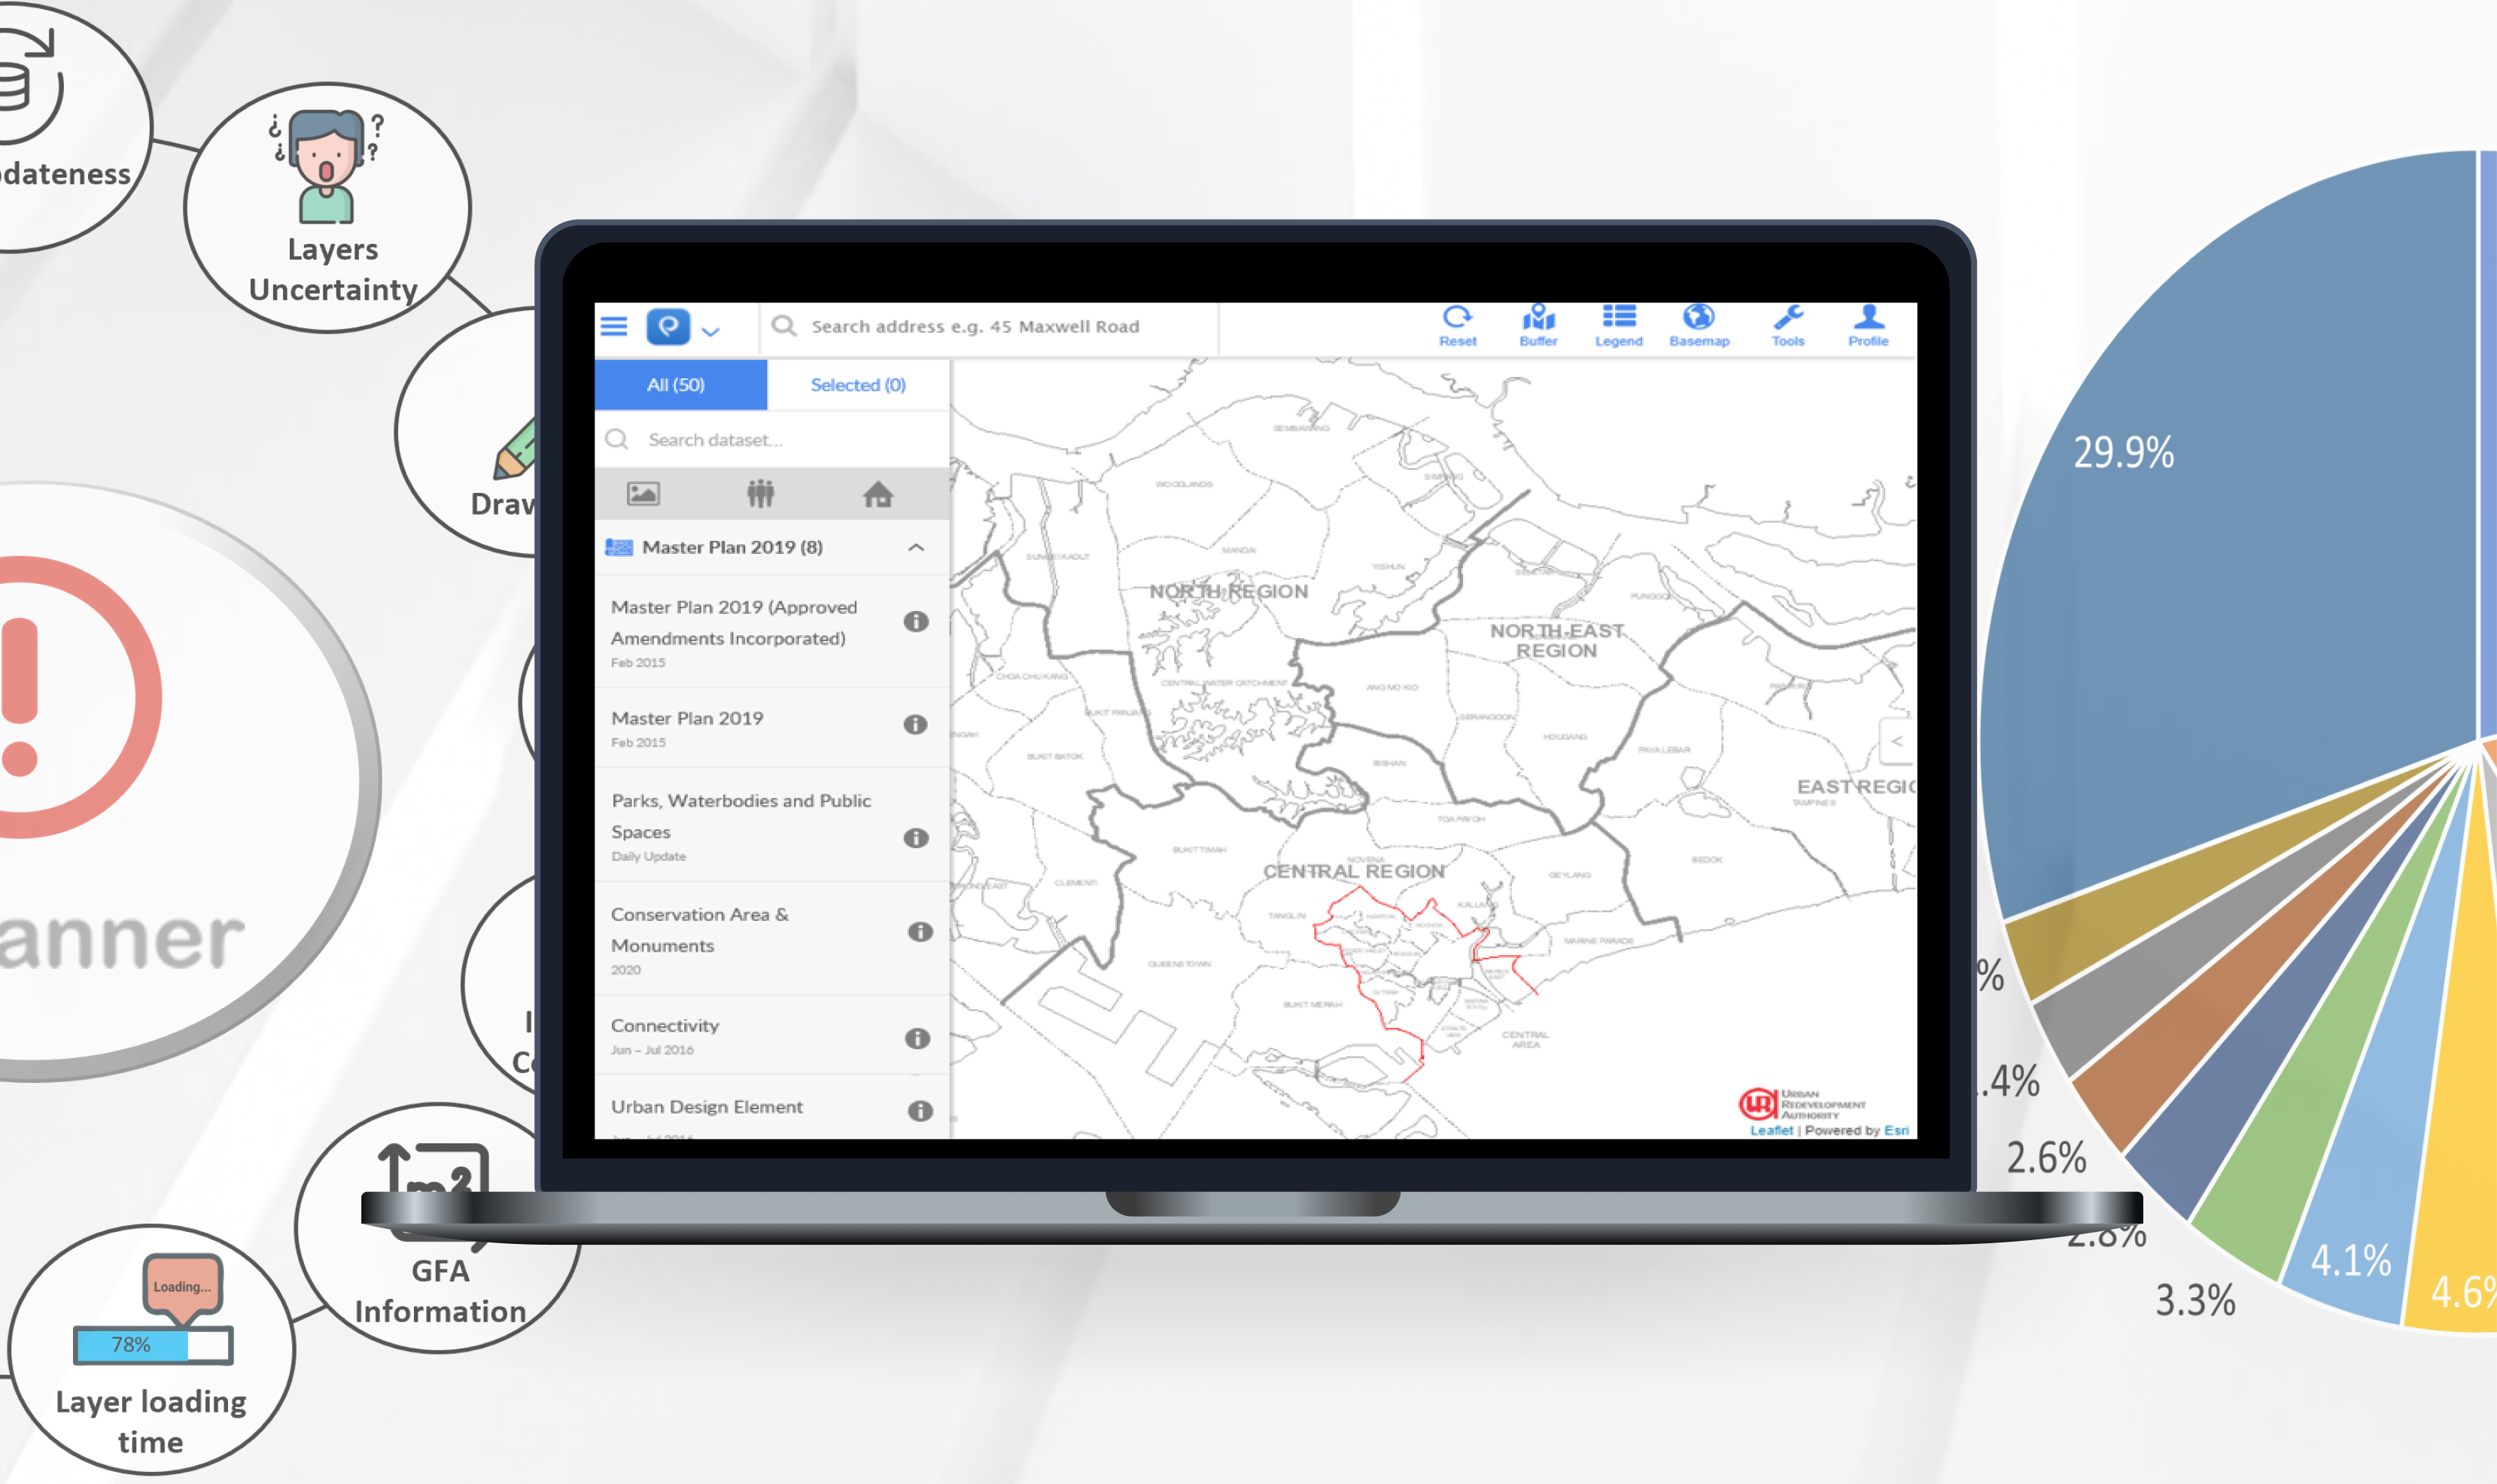
ePlanner is an in-house tool that is being used mainly by staff in the Urban Redevelopment Authority (URA) to help aid work such as planning studies, land use consultation, and the processing of planning applications, which are core work activities in the URA. Despite being an essential tool, little has been done to study the usage pattern of the tool and its efficiency. This means that there might be gaps between what we think the tool is helping the user with and what the user actually uses the tool for. Hence, there is an opportunity to better understand the tool to close the gap (if any) and help users be able to use it to reach their goals efficiently.
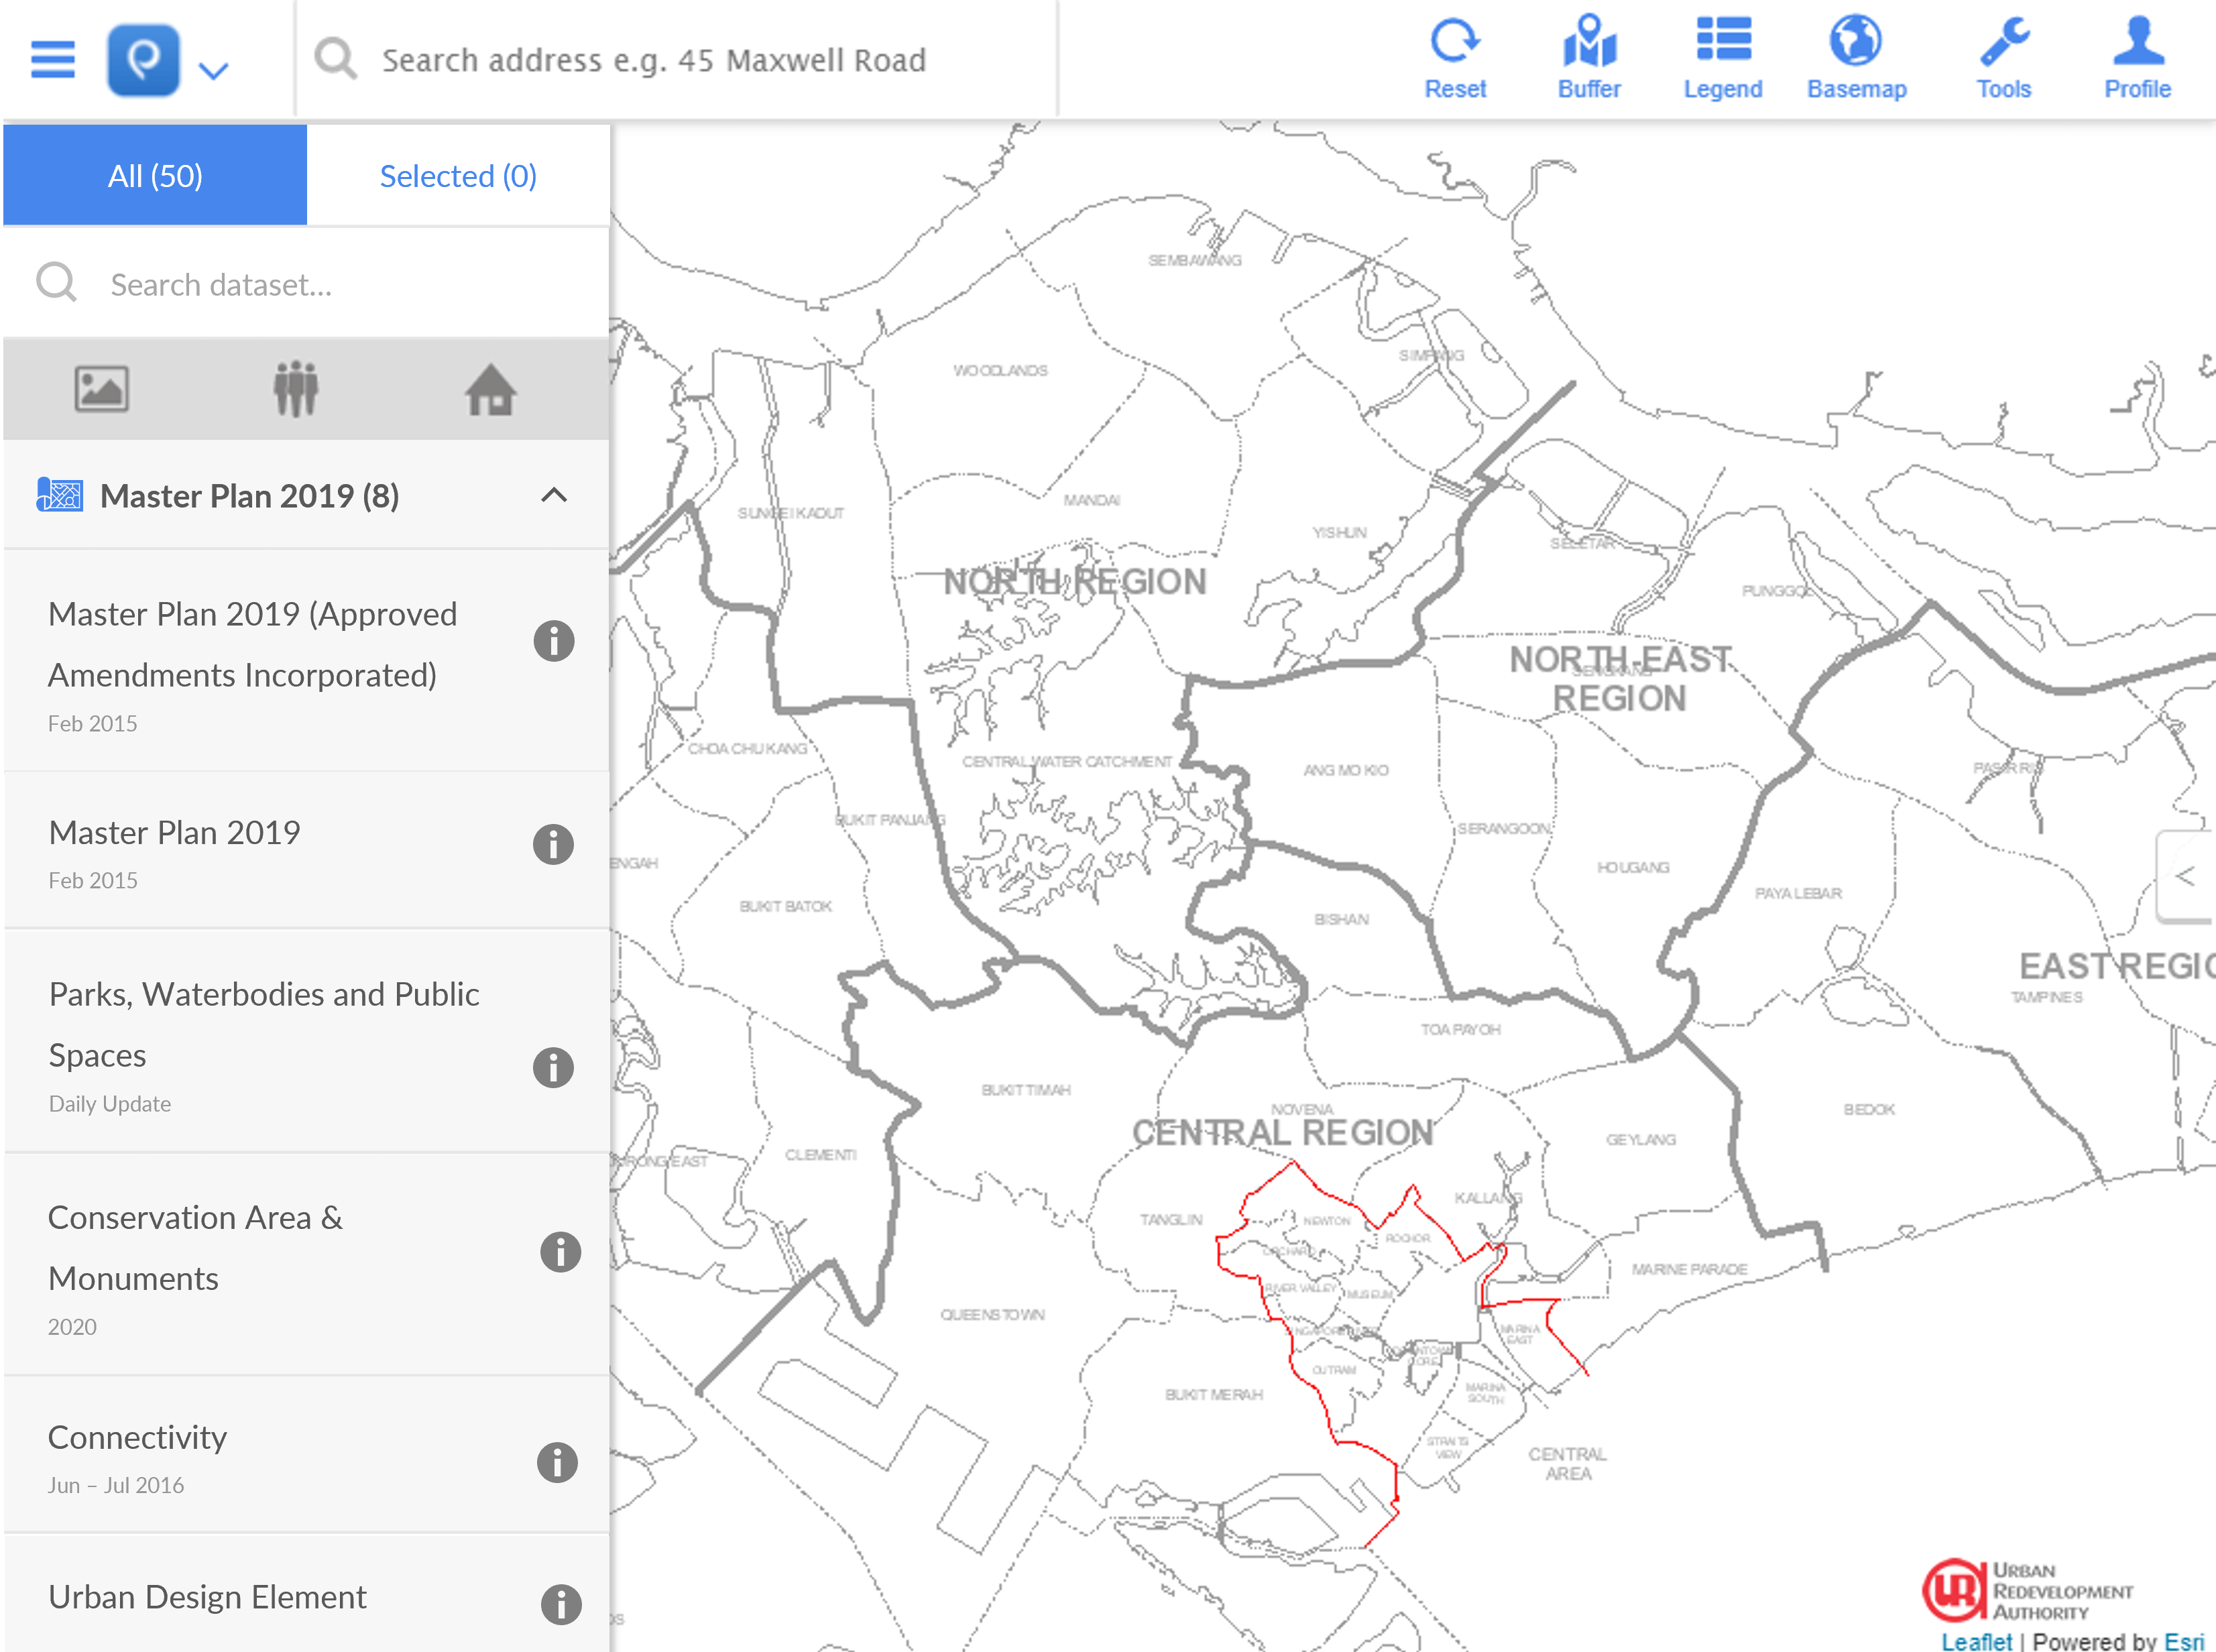
ePlanner Tool
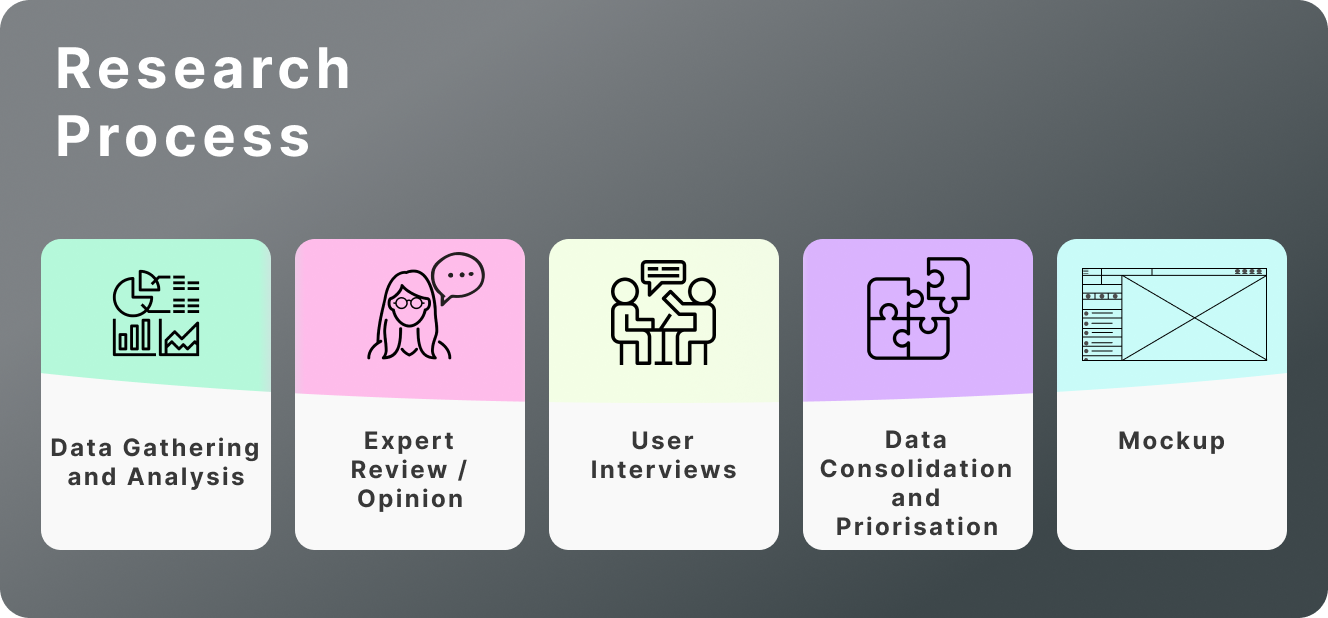
Research Process for ePlanner
To understand the users of ePlanner better, Splunk (data analysis software) was being used to extract the following data for analysis:
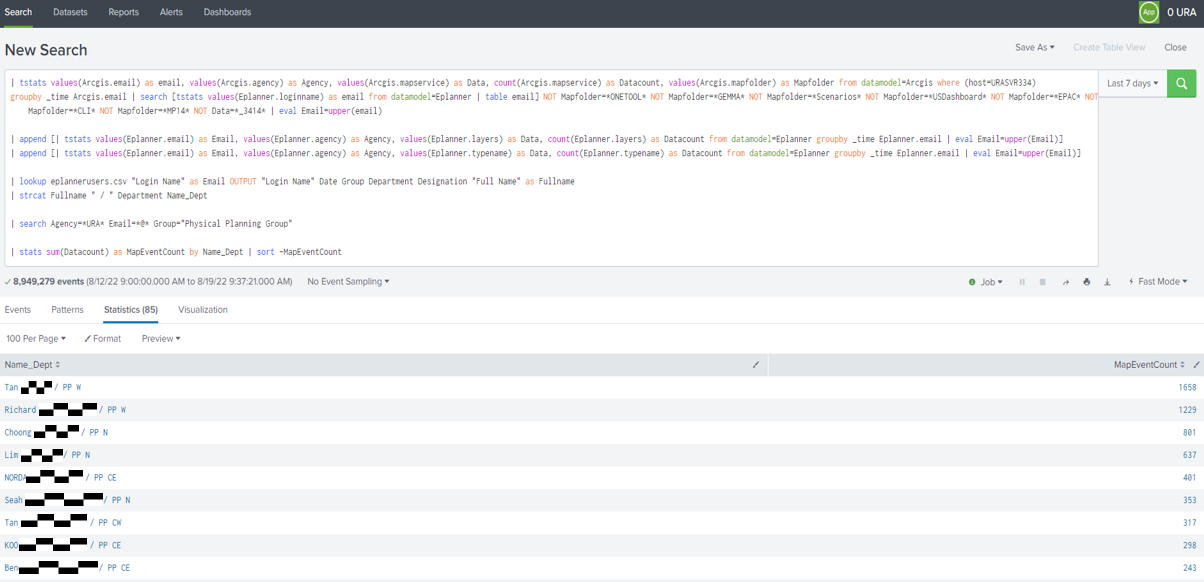
Splunk Software
Top User Groups in URA
Top Users, Designation, and Layers in DCG
Weekly and Daily Usage Pattern of Users
After analysing the data, an expert on the topic was brought in to create hypothesised use cases for the different patterns observed in the data. The hypothesised use cases are then verified by the actual users during the user interviews. The findings are then being consolidated, discussed with the backend developers, and prioritised . The top 5 users from the group are being interviewed mainly to:
User Flows
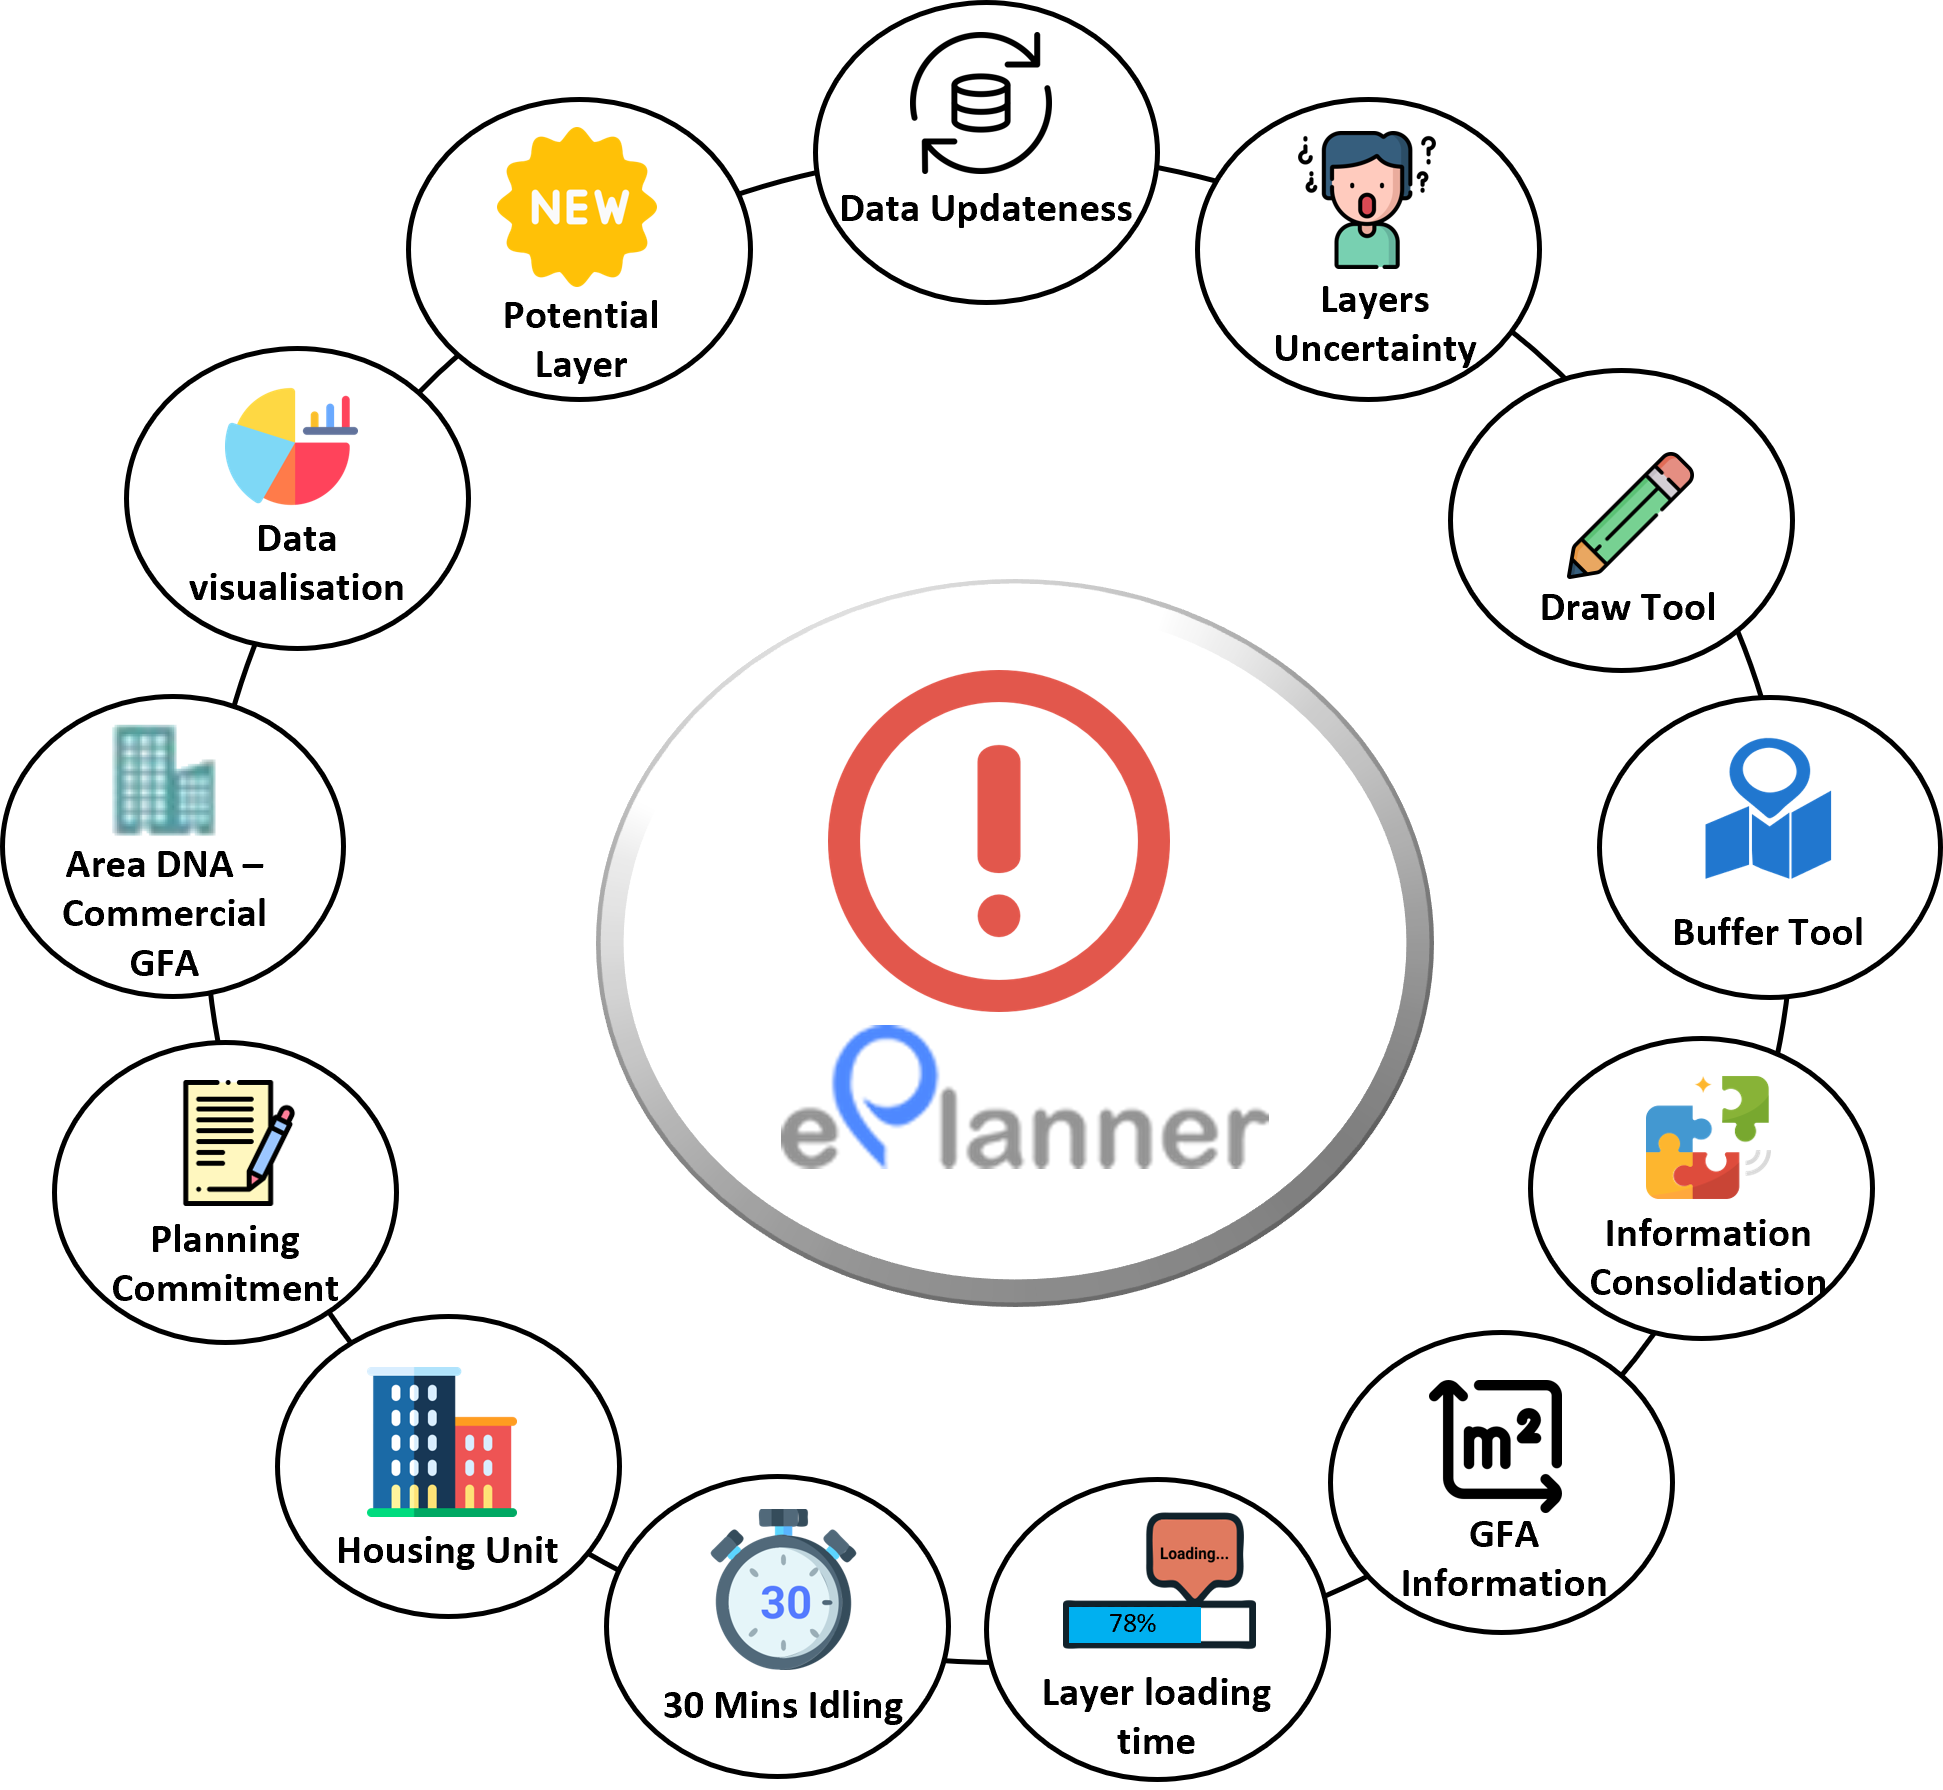
Findings from the Interviews
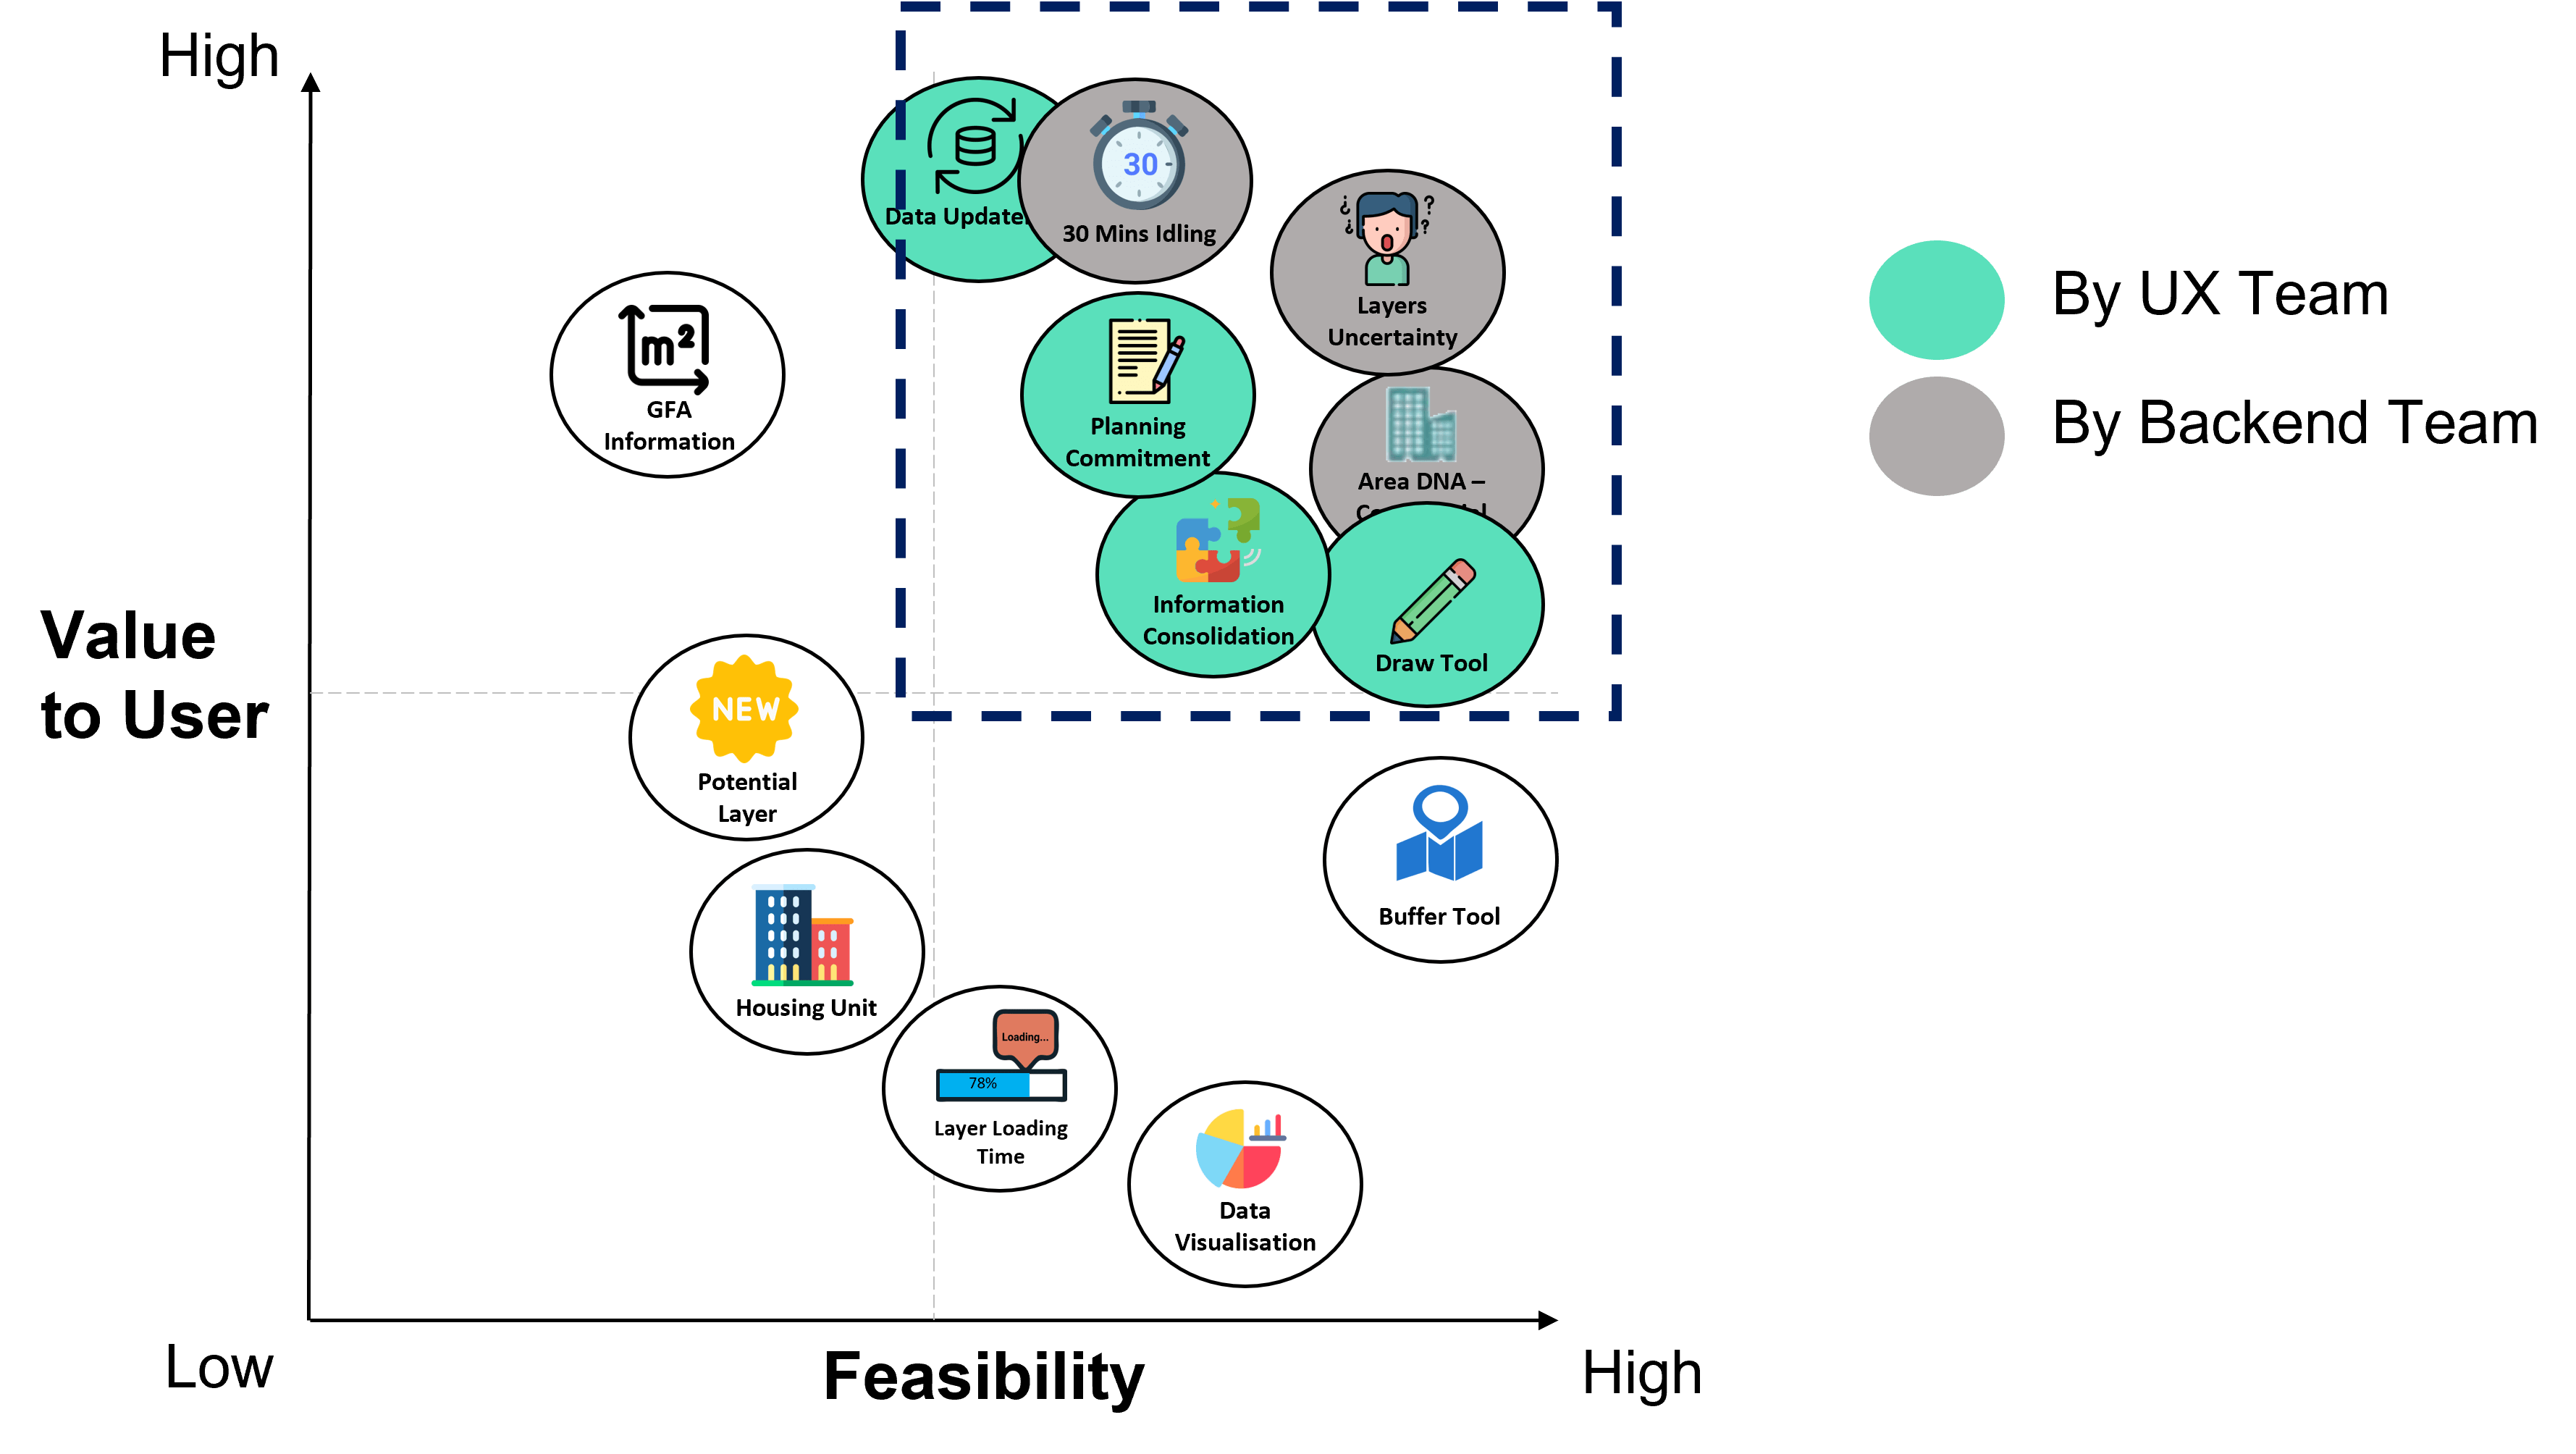
Prioritisation Matrix
The designs for three things have been completed: data updateness date design, information consolidation of land title information and land ownership, and an ePac link layer. *Land title information to be combined with land ownership (information consolidation) and ePac link (planning commitment) design have not been backed up into my personal laptop, hence, there is no mockup to be shown here.
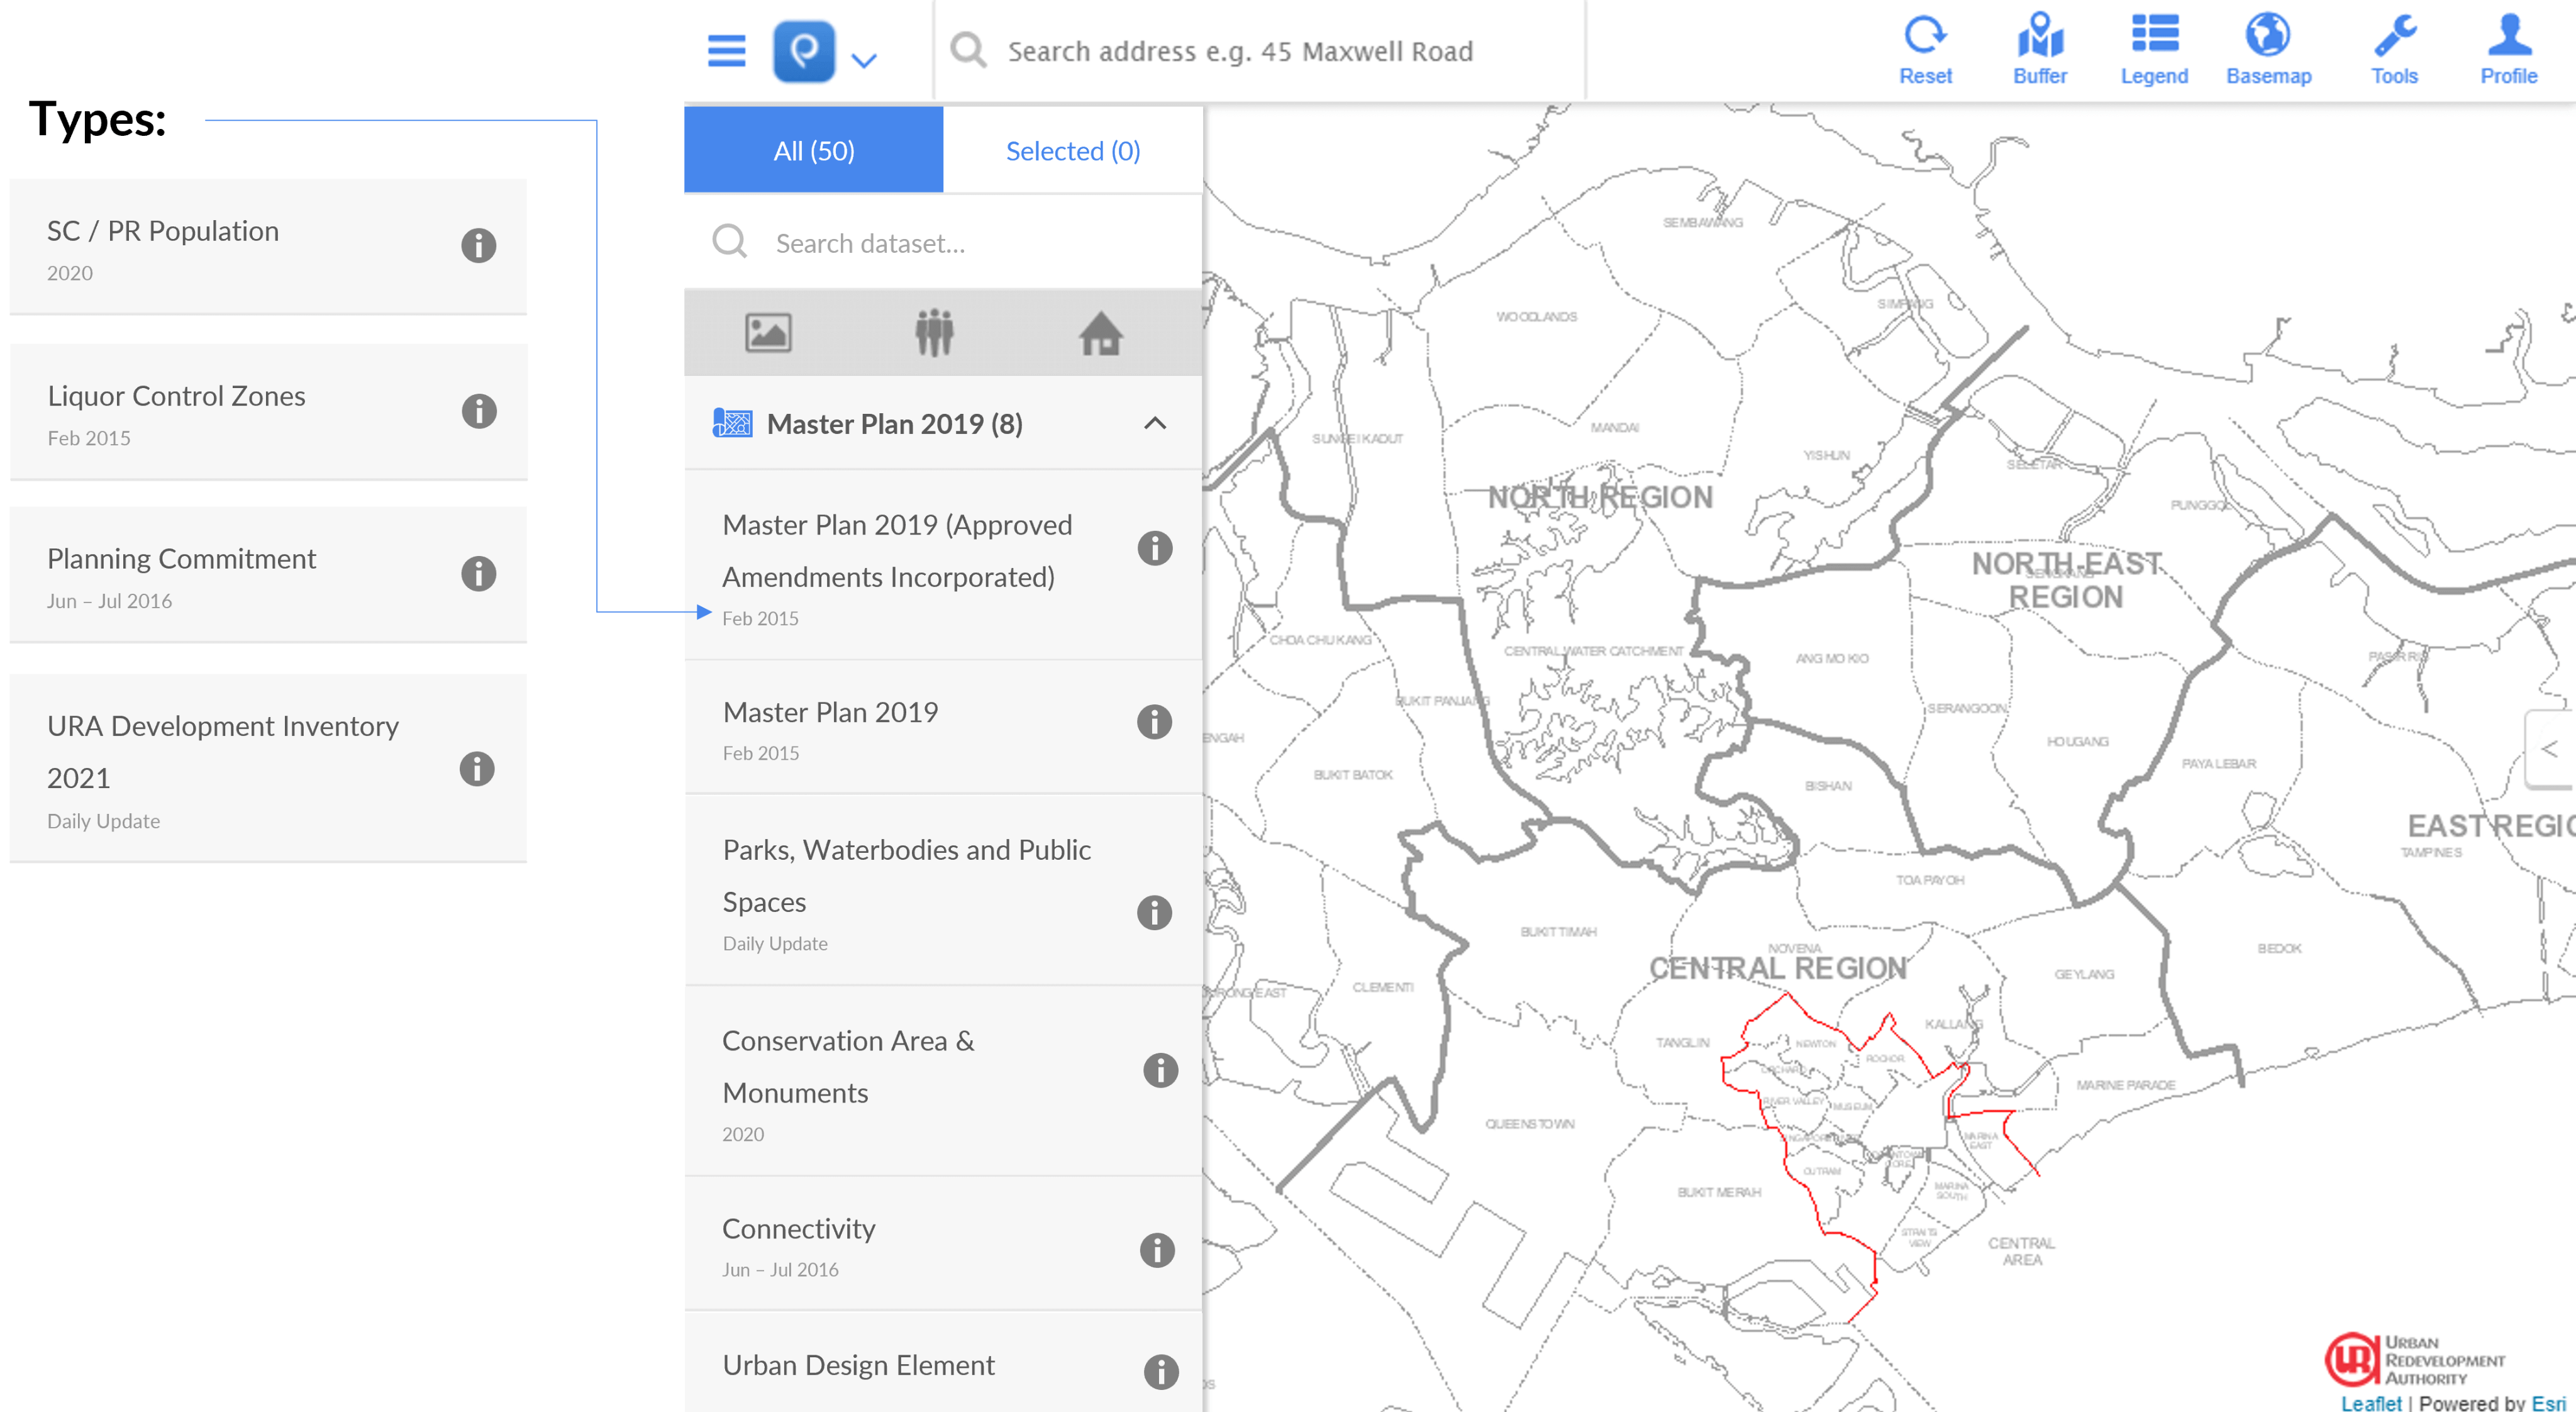
Data Updateness Design
Looking back at the project, I would have written a clear problem statement or opportunity statement at the start of the project so I would know what data I should sieve out for analysis and not doing so much of trial and error. I would also conduct a user testing for each of the design I created so that I could ensure that my design meet the user's needs.